GrafanaCon NYC 2016 Videos
-
 This is GrafanaCon 2016
 -
 GrafanaCon Kickoff Download Slides
 -
 Large-Scale Scientific Computing Monitoring with Grafana Download Slides
 -
 The Launch of Grafana 4.0 and Native Alerting
 -
 The Culture and Reality of Monitoring at Stack Overflow Download Slides
 -
 The Biz of Grafana Download Slides
 -
 The Launch of Snap 1.0 Download Slides
 -
 The Open Source Monitoring Stack at Staples Download Slides
 -
 Launching Graphite 1.0 Download Slides
 -
 Panel - Open Source in the Enterprise
 -
 Circonus and IronDB Download Slides
 -
 Using Grafana at NetApp Download Slides
 -
 NS1 - Intelligent DNS and Traffic Management Download Slides
 -
 Integrating Grafana, Prometheus for Easy MySQL & MongoDB Monitoring Download Slides
 -
 The Harvest/Graphite/Grafana Solution Download Slides
 -
 Elastic-Monitoring Using Grafana at Sony PlayStation Download Slides
 -
 ADP Capacity Planning and Performance Analytics Service Download Slides
 -
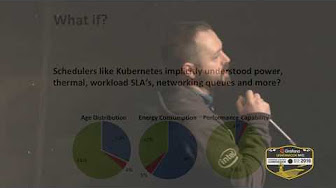
 Intel Snap Telemetry Framework & Plugin Architecture Download Slides
 -
 Monitoring Anomalies in the Experimentation Platform at eBay Download Slides
 -
 The Heatmap and Histogram Panels Download Slides
 -
 Capacity and Performance Analytics Service at ADP Download Slides
 -
 Elastic-Monitoring Using Grafana at Sony PlayStation Download Slides
 -
 Monitoring What Matters Download Slides
 -
 The Hawkular Monitoring Ecosystem Download Slides
 -
 How Gathering Metrics can Save Your Bacon Download Slides
 -
 Monitoring at scale using Grafana @ PayPal Download Slides
 -
 Monitoring InfluxCloud with InfluxDB Download Slides
 -
 Monitioring Your Network from the Inside Out
 -
 Building a Snap Telemetry Plugin Download Slides
 -
 Panel - The Future of Metrics
 -
 Kentik - Network Visibility for All Download Slides
 -
 Grafana 4 Features Demo Session