Speakers
We're proud to have confirmed these amazing speakers.
-
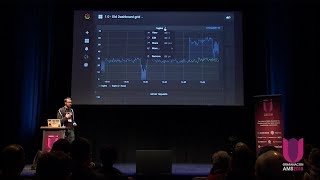
 Google Cloud“Monitoring at Scale with Google Cloud Bigtable”
Cloud Bigtable is Google’s NoSQL Big Data database service. It’s the same database that powers many core Google services, including Search, Analytics, Maps, and Gmail.
Bigtable is designed to handle massive workloads at consistent low latency and high throughput, so it’s a great choice for both operational and analytical applications, including IoT, user analytics, and financial data analysis.
-
-
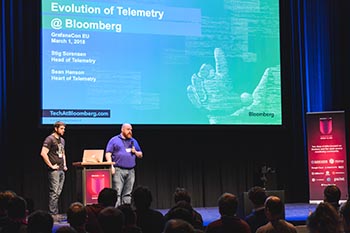
 Bloomberg“Evolution of Telemetry @ Bloomberg”
This talk outlines the components of our monitoring stack (what we’re allowed to share) and what drove us to seek out Grafana in the first place. We discuss our starting point, the challenges we face on a daily basis, and what we plan for the future as we continue to scale.
-
 CERN“Grafana at CERN”
This presentation will give an overview of the growing success of Grafana at CERN with some examples of monitoring solutions and technologies used for the different applications at CERN. We will also highlight which are the most important positive aspects that made Grafana become a tool of reference for new monitoring CERN DC dashboards and we will also mention the possible directions for Grafana improvements and contributions that would particularly benefit large heterogeneous organizations like CERN.
-
 Automattic“Monitoring the Huge Scale at Automattic”
We use Grafana at Automattic for all kinds of task including WordPress.com huge scale, JetPack, MySQL, Elasticsearch, WebSockets monitoring and many more products.
This talk is general purpose talk to gain some insight on Automattic’s monitoring stack and how we use Grafana effectively to visualize and alert on the performance of our systems.
-
-
 Grafana“Grafana v5 and the Future”
The launch of Grafana v5 is probably the single biggest enhancement of the project’s history. New features include a totally revamped layout engine, dashboard folders, and some foundational UX/UI improvements.
We’ll dive into the new features as well as what’s on the horizon for Grafana
-
-
 eBay“Monitoring AI Platform at eBay”
AI platform empowers eBay’s data science and engineering teams to experiment, productize and enable machine learning at scale. Organizations within eBay are allocated fixed capacity and knowing resource utilization over time enables efficient capacity allocation. In addition, user’s would like to know in real time resource usage of their jobs.
Grafana dashboards provide an organization view and user view of resource utilization. In addition, it allows user’s to search for specific job identified by unique ID displaying resource utilization of each task within a job.
-
-
 Robust Perception“Prometheus for Monitoring Metrics”
From its humble beginnings in 2012, the Prometheus monitoring system has grown a substantial community with a comprehensive set of integrations. This talk will give an overview of the core ideas behind Prometheus, its feature set and how it has grown to met the challenges of modern cloud-based systems.
-
-
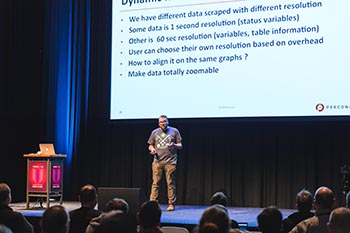
 Percona“What We Learned Integrating Grafana with Prometheus”
We have integrated Grafana + Prometheus to use as foundation for our Open Source Database Monitoring Solution - Percona Monitoring and Management, which now has thousands of active deployments.
In this talk I will talk about our experience integrating Grafana with Prometheus and deploying it at scales - the obstacles we had and overcome and exciting possibilities Grafana has offered us.
-
 Grafana Labs“The Biz of Grafana”
Building a company around an open source project is not for the faint of heart. Find out what we’ve been up to since our last GrafanaCon, How the team has grown, our view on the open source software landscape, and what’s to come for Grafana Labs.
-
-
 Grafana Labs“What's New In Graphite”
I started working on Graphite just over a year ago, to help out with some issues blocking the Graphite 1.0 release. Little did I know that a year later, that would have resulted in 262 commits (and counting), and that with the help of the other Graphite maintainers, we would have added a huge amount of new functionality to Graphite.
In this talk I’ll give a tour of some of the highlights including tag support, syntax and function updates, custom function plugins, and python 3.x support.
-
-
 InfluxData“The Design of IFQL, the New Influx Functional Query Language”
The new InfluxDB query language is functional in nature. Conceptually it looks like D3 or jQuery. Functions are chained off each other. This gives greater flexibility for what the language can do and opens up new possibilities for UI builders. This talk will cover the details of the language and user interface ideas that can pair up nicely with it. We’ll look at query examples that perform math on metrics, interpolation, and similarity measures.
-
-
 Inuits“Writing Grafana dashboards with Jsonnet”
Jsonnet is a tool that allows you to write Json files easily, handle repetitions, data, etc.
Terraform is a tool that works with may API’s to create/update/delete objects from a codebase. It is mainly known in the cloud area but has support for grafana too.
Combining those two solutions allows you to write many dashboards in no time - in a reproducible way. And even to create basebricks for multiple dashboards and reuse them at will.
-
-
 Grafana Labs“Introduction to GrafanaCloud”
GrafanaCloud makes it easy to set up, operate, and scale a complete Grafana stack in the cloud.
We’ll discuss the components of GrafanaCloud, how it scales, and how to achieve true interoperability leveraging open source software and avoid SaaS lock-in.
-
-
 Grafana Labs“MetrickTank”
Just what the world needs – another metrics backend. Dieter will talk about the motivations for building MetricTank, its features, some of the benchmarking, and what we envision for v-next.
-
-
 Grafana“Provisioning Grafana”
Plugins for Grafana’s frontend have been a big success since we launched Grafana 3. There are over 40 different plugins available for installation at grafana.com.
Introducing plugins for Grafana’s backend will make it possible to extend Grafana even further. Backend plugins will enable alerting integrations for any data source, new alert notifiers, new authentication and authorization integrations and more.
-
-
 Natel Energy“Running a Power Plant with Grafana”
Natel Energy is building a low cost, distributed, grid-scale hydropower turbine. We began using traditional industrial control packages to manage and develop our projects. These products tend to be expensive, fragile, hard to scale and ugly. With Grafana, we found a great platform to build a good looking, secure and scalable control system. Rather than build a new application we are now building all our operational interfaces directly in Grafana plugins.
-
-
 Würth Phoenix S.R.L.“When Performance Metrics and User Experience Come Together”
When performance metrics are combined with active user experience and machine learning, we can gain new insights about why a business critical application is slow, what components are involved, and how this impacts users and hardware.
By interlinking several levels of dashboards, users from different departments can get a more transparent view of the issue and exchange problem related information as easy as sending a hyperlink to a specific dashboard to their colleagues. Thus troubleshooting and root case detection become much easier.
But collecting up to 500 mio datapoints per day per customer is not trivial.
-
 Red Hat Inc.“Analyzing Performance of OpenStack with Grafana Dashboards”
Significant amounts of time have been invested in performance testing and analysis of OpenStack.
In this talk I share how we use Grafana and many other Open Source tools to monitor the performance of an OpenStack Cloud while benchmarking.
We’ll show the components of the monitoring stack and benchmarking tools, share the dashboards which help speed up OpenStack Performance Analysis, and run through scenarios showcasing how the dashboards have exposed issues and helped improve OpenStack performance.
-
-
 Netways“Graphs Tell Stories”
Dave just started his new job as a Systems Engineer in this strange IT company. His ambition is to become the most aspiring and omniscient operator the company has seen.
Through his journey of debugging issues and hunting users he learns many things helping him to troubleshoot and improve running systems. Unfortunately, at some point in his career, Dave reaches a moment where none of the learned techniques can’t help him.
What he needs is something that that can display all the data he collects with different tools in one single place.
This story is about how the art of data visualisation can change your whole perspective and help you find the right answers.
-
-
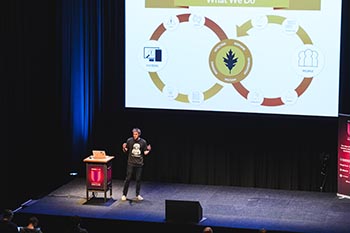
 Shell Technical Landscape Services“Storage monitoring at Shell Upstream”
After insourcing the majority of subsurface technical storage at Shell uptream, we were limited by the commercially available monitoring solution. A Proof of Concept was held using a data collector, InfluxDB and Grafana. This enabled us to monitor the full globally installed base on a single dashboard as well as drilling deep into specific storage clusters.
We’ll show the interesting and completely unexpected advantages of implementing Grafana and the insights we’ve gained.
-
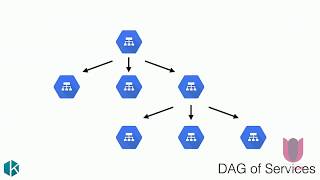
 Kausal“The RED Method: How To Instrument Your Services”
The RED Method defines three key metrics you should measure for every microservice in your architecture. It gives developers a template for instrumenting their services and building dashboards in a consistent, repeatable fashion. We will discuss patterns of application instrumentation, where and when they are applicable, and how they can be implemented with Prometheus. We’ll cover Google’s Four Golden Signals, the RED Method, the USE Method, and Dye Testing. We’ll also discuss why consistency is an important approach for reducing cognitive load, and discuss the limitations of these approaches and what can be done to overcome them.
-
-
 Evolution Gaming“Grafana usage in the Quality Assurance Process”
In my talk I would address how Grafana can be very useful in the quality assurance field.
I will give insights of how visualisation of data can improve testing process by Grafana usage in performance tests, monitoring of test environments and other QA activities and which time series data base fits best for such tasks.
-
-
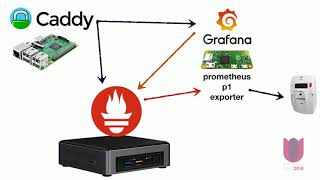
 Snow BV“Using Prometheus and Grafana for Monitoring my Power Usage”
In this lightning talk I’ll explain how I gained insights in my power usage using a raspberry pi zero w, Prometheus and Grafana.
I now have a real time view of my power draw, statistics about my power usage over the last week and I can even look at my dashboards to determine whether the washing machine is done or not.
-
-
 Energy Weather“Weather, Power & Market Forecasts with Grafana”
We’ll highlight, how Grafana can be used to visualize future data, although default usage is focussed on historical data.
In addition to this, we’d like to give a short introduction on the increasing weather impact on financial markets like the energy trading business and use Grafana to demonstrate how weather forecasts, resulting renewable energy production and finally price developments are connected.
Finally, we’d like to start a discussion, on how Grafana could be improved for the usage in non-monitoring businesses.
-
 Amgen“Inherited Technical Debt - A Tale of Overcoming Enterprise Inertia”
Amgen has been on a journey to confront the multi-million dollar elephant in the room. Technical debt that had been passed down for 10 years in their monitoring portfolio.
But how to overcome inertia and a failure to understand how to maximize internal value for data that belongs to organization to begin with?
I’ll discuss lessons learned, where it was, where it is now, and what steps we took to achieve technical value given back to the business through open source, modular layers and with a design for programmatic monitoring at global enterprise scale.
-
-
 Weaveworks“Grafanalib: Dashboards as Code”
Grafana has a great UI for creating dashboards, but what happens when you want to start implementing common patterns, or change your dashboard at the same time that you change your monitoring?
Why not treat your dashboards like code? We do that with grafanalib, which is a Python EDSL for building Grafana dashboards.
This talk will show how you can use grafanalib to manage your dashboards, some cool things you can do with it, and talk a little bit about its design & internals.
-
-
 Inovex“The Journey of Shifting the MQTT Broker HiveMQ to Kubernetes”
From zero to Kubernetes: Which challenges do I face while migrating a cloud-unready Java application such as HiveMQ from a classical Linux IT- environment to Docker-Orchestrator Kubernetes?
In this talk we want to show you the technical problems we had to solve and how monitoring setup helped us to handle critical incidents in production.
-
-
 Booking.com B.V.“Graphite@Scale or How to Store Millions of Metrics per Second”
This is a story about dealing with metrics at scale. A lot of metrics.
This is our story of the challenges we’ve faced at Booking.com and how we made our Graphite system handle millions of metrics per second.
You should expect to learn about one of the most high load Graphite stacks, the problems it poses and the challenges in maintaining it and scaling it further, pushing Graphite to its limits and beyond.
-
-
 New City Energy“Bringing Observability to the Built Environment at City Scale”
Since 2013 New City Energy has been helping the City of D.C. measure and improve the efficiency and performance of its building portfolio through a number of policy and technology innovations. In 2016, NCE began building out a cloud based platform to allow deep insight to the portfolio at a room-by-room level.
Learn how we’ve structured the architecture to enable this platform, the context of how Grafana interacts with the other components in the system, and how the entire system delivers value to the City.
-
-
 Timescale“Using PostgreSQL, Prometheus & Grafana for Storing, Analyzing and Visualizing Metrics”
In this talk, we take a somewhat heretical stance in the monitoring world, and describe why and how we chose to use PostgreSQL as a Prometheus backend to support complex queries (and get a full SQL interface).
Until recently, the databases supported by Grafana have been NoSQL systems, offering SQL-like or custom query languages that were limited in scope, and designed for specific data model and architectures in mind.
-
-
 Grafana Labs“Kubernetes and Grafana”
Monitoring Kubernetes is vital to understanding the health and performance of a cluster, but which metrics are most important to add to your dashboards and alert on?
Jacob will discuss how to most effectively monitor and visualize your Kubernetes cluster using the Grafana Kubernetes plugin and PromQL.
-
-
 Microsoft“Cosmos DB and Grafana”
 -