Check out all the talks from GrafanaCon EU 2018
-
 GrafanaCon EU 2018 Kickoff Download Slides
 -
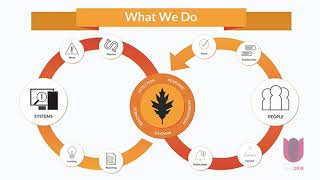
 Grafana at CERN Download Slides
 -
 Grafana v5 & the Future of Grafana Download Slides
 -
 The Business of Grafana Labs Download Slides
 -
 Introduction to GrafanaCloud Download Slides
 -
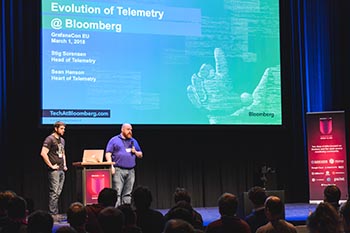
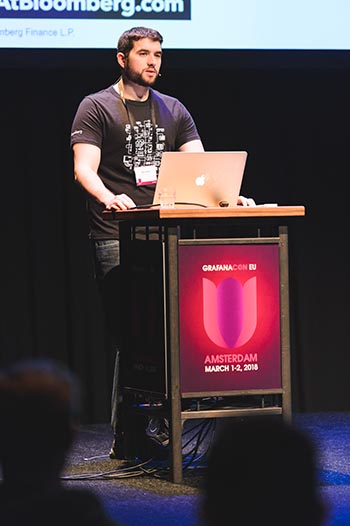
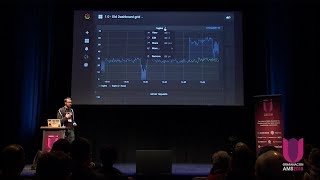
 Evolution of Telemetry at Bloomberg Download Slides
 -
 IronDB Download Slides
 -
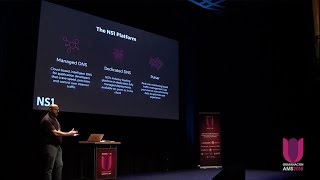 NS1 – Intelligent DNS and Traffic Management Download Slides
 -
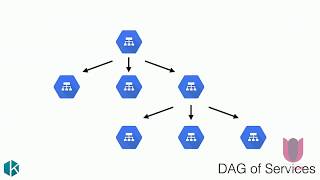 The RED Method - How To Instrument Your Services Download Slides
 -
 Grafana Usage in the Quality Assurance Process Download Slides
 -
 Inherited Technical Debt - A Tale of Overcoming Enterprise Inertia Download Slides
 -
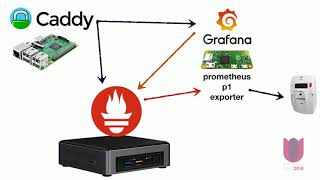 Using Prometheus and Grafana for Monitoring my Power Usage Download Slides
 -
 Running a Power Plant with Grafana Download Slides
 -
 Graphite at Scale or How to Store Millions of Metrics per Second Download Slides
 -
 Bringing Observability to the Built Environment at City Scale Download Slides
 -
 Monitoring eBay's AI Platform Download Slides
 -
 Welcome & An Intro to Provisioning Download Slides
 -
 What's New Timescale Download Slides
 -
 What's New in Graphite Download Slides
 -
 What's New in InfluxDB
 -
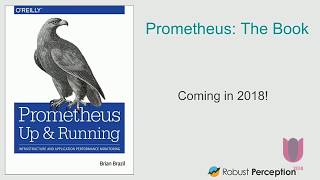 What's New in Prometheus Download Slides
 -
 TSDB Panel Discussion
 -
 What we Learned Integrating Grafana with Prometheus Download Slides
 -
 The Design of IFQL, the New Influx Functional Query Language Download Slides
 -
 Weather, Power & Market Forecasts with Grafana Download Slides
 -
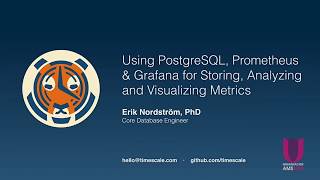
 Using PostgreSQL, Prometheus and Grafana for Storing, Analyzing & Visualizing Metrics Download Slides
 -
 The Grafana Labs Poster Series
 -
 VictorOps Download Slides
 -
 Grafanalib - Dashboards as Code Download Slides
 -
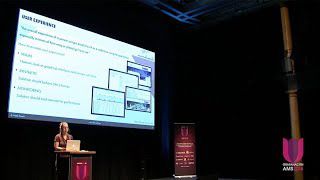 When Performance Metrics and User Experience Come Together Download Slides
 -
 Automating Grafana Dashboards with Jsonnet Download Slides
 -
 The Journey of Shifting the MQTT Broker HiveMQ to Kubernetes Download Slides
 -
 What Does Kubernetes Look Like? Performance Monitoring & Visualization with Grafana Download Slides
 -
 Storage Monitoring at Shell Upstream Download Slides
 -
 Analyzing Performance of OpenStack with Grafana Dashboards Download Slides
 -
 Graphs Tell Stories Download Slides
 -
 Thanks & Closing Remarks Download Slides