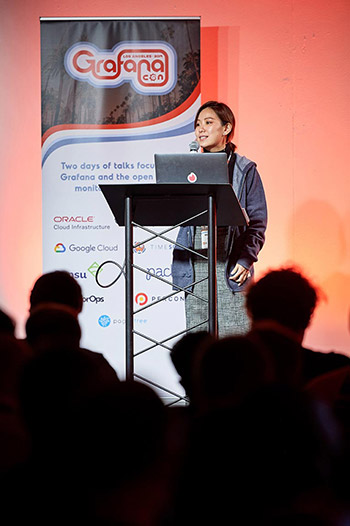
GrafanaCon is a two-day event with talks focused on Grafana and the surrounding open source monitoring ecosystem. In addition to the latest features and functionality of Grafana, you can expect to see and hear from members of the extended open source monitoring community.
We’re shaking up the format for day 2 to include TSDB focused tracks and workshops on popular monitoring tools and how to get the most out of your data and Grafana. Learn more about the conference format.
Day 1 at GrafanaCon LA will be single track and have keynotes from the core Grafana team, talks from the creators and maintainers of the most popular open source monitoring tools, and hear from the community on observability and monitoring at scale.
Day 2: Based on your feedback, GrafanaCon is getting a lot more hands on! GrafanaCon LA is going to feature TSDB focused tracks and workshops led by experts that will let you roll up your sleeves with:
We’ll host open office hours from noon to 1pm in the Track 3 room, after the last SQL/BA talk.
Have a burning question for the core team? Want to dig in more into the specifics of our platform or new projects like Loki? Want to chat with the co-founders? Now’s your chance!
Learn how to start developing new features for Grafana and contribute to making the project better.
Learn how easy it is to create your own data sources & panels.
A deep dive into various feature areas of Grafana.
Learn more about some of the most popular plugins and how you can start using them today.
Troubleshoot slow graphs, and find out what to do if your metrics aren’t loading. Learn how to optimize your queries, pitfalls to avoid, and get the most out of your dashboards.
Carl will walk you through the dashboard provisioning functionality, as well as how to set up folders, teams and permissions. He’ll also discuss how to run Grafana in a HA environment.
In this talk the creator and project leader Torkel Ödegaard will give a general project update. Showcase the main features added during the last year as well as unveil what is new in Grafana 6.
This talk will cover experience and thoughts about how to approach the monitoring and management of cloud-native systems. It will draw both from observations of the opportunities provided by systems like Kubernetes as well as from practical hands-on experience from building real monitoring systems. With luck it will provide both experiences from the past, and inspirations for the future.
This talk will focus on how the telemetry team delivers value for Bloomberg’s 5,500+ engineers around the globe, with as little effort as possible required by application or SRE teams.
Learn about enhancements Bloomberg made to open source software, as well as successes (and failures) in adopting various performance metrics.
Take away some plans and starter code for how to use Grafana at home for whimsical and educational purposes. Inviting family to do these projects with us is a great way to help them understand what we do at work all day! But the benefits extend far beyond keeping a child entertained.
We’ll conclude with some thoughts about how we can take these lessons and apply them towards making our own workplaces better. We can all strive to “Explain it like I’m five” to each other more often – not to be patronizing, but to encourage a culture of tinkering and playfulness, without the fear of breaking things.
Have you thought about running Grafana exposed to everyone on the internet? Probably not!
At GitLab we value transparency, so this is exactly what we do. Every metric we use for running gitlab.com is visible to the public.
This talk will give an overview of how we operate Grafana, Prometheus, Trickster, and Thanos to create both internal and external dashboards.
The new Flux (formerly IFQL) super-charges queries both for analytics and data science. Get an overview of the language features as well as the moving parts for a working deployment. Grafana shares Flux’s passion for analytics and data science. For that reason, they are very excited to showcase the new Flux support within Grafana, and a couple of common analytics use cases to get the most out of your data.
In this talk we will discuss the motivation behind Loki, its design and architecture, and what the future holds. Its early days, but so far the response to the project has been overwhelming, with more the 4.5k GitHub stars and over 12hrs at the top spot on Hacker News.
Grafana isn’t only used to visualize infra monitorig. More people are visualizing data from sensors and other IoT devices in their homes and businesses.
In this hands-on workshop, learn how to collect data from a temperature sensor and visualize the data in Grafana.
Applications are complex systems. Their many moving parts, component and dependency services, may span any number of infrastructure technologies and platforms, from bare metal to serverless. Learn how to overcome many of these challenges and effectively monitor these ever-changing heterogeneous environments.
Sensu supports four different metric formats for check output metric extraction, and can integrate with any time series database as long as there’s a handler written for it. Get an overview of just one of the endless permutations of metrics software you can pair with Sensu:
Grafana, with its huge amount of data sources and plugins, has all the capabilities one needs to create accurate graphs. Although creating dashboards is easy, interpreting each panel is hard if it’s not correctly visualised. Misinterpretation is one of the most common causes of wrong conclusions that make us hunt ghosts during debugging sessions. There are many common pitfalls which we can avoid if we follow some rules.
Learn about some of the most common mistakes in visualizations and how to avoid them.
Get an overview of how Amgen has implemented oncall data to be viewable within Grafana so that anyone looking up an app that has some alerts associated with it can also know who the current engineer oncall and what their information is in case anyone needs to proactively reach out to them regarding degraded user experience, before any alerts are triggered.
Grafana 6.0 adds a new way to explore ad-hoc queries and data. You can now view both metric and log data in Grafana.
David will walk through the new interface of the explore workflow and discuss what’s on the horizon.
The role of IoT to produce tangible impacts on the ground in Africa. How we used Grafana and InfluxDB to be able to remotely monitor our mini-grids in Tanzania. This reduced the number of long and cumbersome site trips and enabled us to guarantee a 24/7 power supply.
See how IoT devices truly increased the standard of living in the community including smart water pump operation and the supply of power for a welding business.
This talk is delivered by TimescaleDB, who contributed the PostgreSQL query builder. It covers the rationale for why we decided to contribute these new functionalities, offers an overview of the new features, and provides insight into the real-world examples of how users are leveraging Grafana and SQL to power analytics and visualizations across their organizations.
This talk focuses on the journey that eBay took in rethinking how they do monitoring with the help of Grafana and the lessons they learned along the way.
At SevOne we collect high resolution network telemetry data where live visualization of that data is crucial for operations. Using a refresh rate on a large report fetches duplicate data unnecessarily, slowing the user experience. We decided to investigate adding streaming to Grafana, and found it was possible without any modifications to the Grafana server.
Raj will provide an update on Grafana Labs and provide some insight on building a company around an open source project. Grafana Labs has grown tremendously since the last GrafanaCon. Learn about how the team has grown, our view on the open source software landscape, and what’s to come for Grafana Labs.
In this session, we will showcase Grafana’s immense usage at Tinder:
In this session, we will inject some chaos into a Spring Boot application. We will collect all the metrics from the application and the experiments in Prometheus. We will create Grafana dashboards to visualize the results and see how the application is performing in the real world.
The Google Cloud team worked closely with Grafana Labs to build a Stackdriver data source for Grafana. This new plugin lets you seamlessly incorporate Stackdriver data into your Grafana instance effortlessly.
A new breed of open-source building blocks is emerging — and is bringing Internet-scale best practices to the industrial IoT space. These building blocks implement open, standards-compliant communications protocols, allowing devices and data streams to be connected in a secure, flexible and scalable way. Grafana — given its time-series focus, and flexible/extensible design — is the natural front-end for this.
This talk will cover some of underlying technologies, focusing on the ways in which Grafana delivers key functionality.
Explore how Trapeze is leveraging Grafana as a key platform for visualising and communicating a real-time picture and how this is being utilised within Emergency Service organisations. We will discuss how we are supporting critical decision making through bringing together a broad range of information streams and technology. This talk will discuss some of our current stack and areas were currently exploring including Grafana, Postgres, SQL Server, Kafka, MQTT and Prometheus.
Goutham Veeramachaneni, a Prometheus project contributor, will give you an inside look at the latest developments of Prometheus and what’s on the horizon.
Learn about Hastic - a hackable tool for making pattern detection and predictions for your timeseries data, and explore Grafana plugins to create visualizations and custom analytics from new data sources.
Learn about managing Grafana dashboards like code: checking them into source-code repository and deploying them to every Kubernetes cluster via an automated build system. This ensures the Grafana dashboards are consistent across all Kubernetes clusters, making for a more productive and reliable experience.
Learn about the new Azure & Stackdriver data sources and get to know some of the popular community Grafana plugins.
While Grafana is super popular tool for visualizing monitoring data, it can go well beyond that.
In this presentation we will show how you can visualize virtually any business data in beautiful Grafana dashboard as well as offer some tips how you can go beyond MySQL if you’re looking for high performance interactive dashboards.
Kubernetes generates a wealth of metrics from several places. Some explicitly within the Kubernetes API server, the Kublet, and cAdvisor or implicitly by observing events such as the kube-state-metrics project. A subset of these metrics are used within Kubernetes itself to make scheduling decisions, however, other metrics can be used to determine the overall health of the system or for capacity planning purposes.
In this session you will learn about:
Learn about how these metrics are calculated, their use within Kubernetes scheduling decisions and application in monitoring, alerting and capacity planning.
In this session, learn how to set up Grafana with Flux and start writing queries in Grafana’s new Flux query builder.
Flux is InfluxData’s new functional data scripting language designed for querying, analyzing, and interacting with data.
Find out how to use InfluxData’s new functional data scripting language Flux to track data for your IoT sensors and smart devices.
Join the automation and tools team within Verizon’s Global Technology Solutions organization for highlights on Grafana implementation in an enterprise environment. In this presentation we will quickly explain how the combination of Grafana, MySQL, and new technical innovations simplified analytics and automated development efforts.
Ryan has developed a number of plugins for Grafana and will showing off some of the features and conducting demos.
After a long day of talks, demos and networking, we think it's important to unwind a little. We have two after conference events on the first evening that you won't want to miss.
Directly following the last talk on day 1, we’ll head upstairs to the Magic Box Main Lobby for the after conference reception. There you’ll enjoy food, drinks, and plenty of time to chat with fellow attendees.
Beginning at 8pm, following the after conference reception, we’ll have a Grafana 6 launch party at the Tom’s Urban UPour Floor. The private events space located upstairs at Tom’s Urban gives you access to 50 beer taps to choose from, along with food and time to unwind after a great first day of talks.
Magic Box @ The REEF is Los Angeles’ newest downtown meeting space. Housed in the iconic LA Mart building, this collection of gorgeous, modern, renovated spaces will play host to GrafanaCon LA.
ADDRESS: 1933 S. Broadway, Lower Level, Los Angeles, California 90007
Sponsoring GrafanaCon offers valuable exposure and a great way to connect with Grafana users, the extended Grafana community, as well as monitoring and open source software enthusiasts. Each GrafanaCon has been bigger and better than the previous in every way, and GrafanaCon LA will be no exception! Download our Prospectus to learn more about our sponsorship levels. For additional sponsorship opportunities, or to inquire about custom packages, please email us, we’d be happy to work with you.